One of the advantages of diabetes technologies, particularly Continuous Glucose Monitors (CGMs), is having access to blood glucose data. Much like the many fitness data collection devices, CGMs identify patterns for the wearer to aid in behavior modification. For example, if you see a pattern of high glucose levels after breakfast every day, you are then alerted to the need to make a change in either insulin doses or the food consumed.
But how do you know what changes to make? Do you have to ask your endocrinologist to look at your data to make insulin adjustments? How will you know if the changes you made are working as intended? We hope to arm you with the tools you need to identify glucose patterns and make adjustments safely, with the support of your healthcare team when needed.
Step 1: Looking at the Data
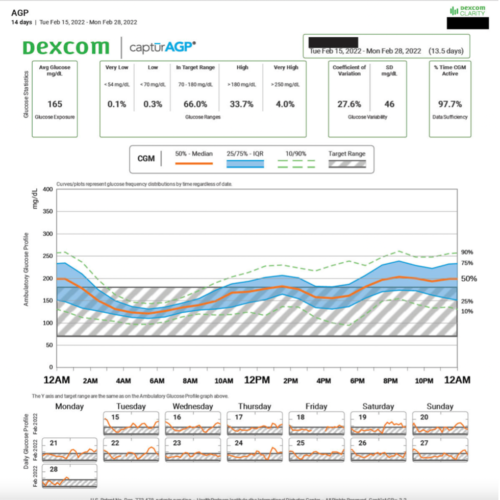
The Ambulatory Glucose Profile (AGP) is the current standard report for a continuous glucose monitor.1 This report includes information on Time in Range, glucose variability, and shows patterns that are seen in the CGM data. It also shows the average glucose over the period chosen, which can be up to three months, and provides a glucose management indicator (GMI). The GMI is an estimate of the HbA1c based on the CGM data, which is not meant to be a substitute for A1C measurements, but an added benchmark for meeting glucose targets.
Here is an example of the AGP from Dexcom Clarity, the reports look similar for Libre.
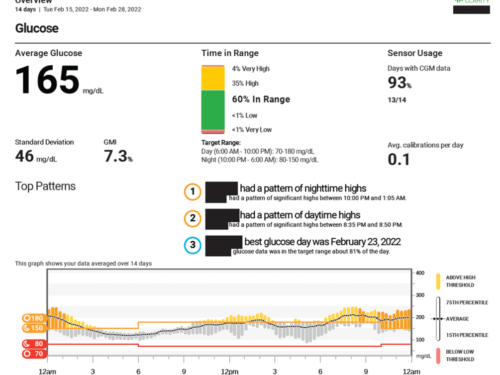
Another great visual from Dexcom Clarity is the Overview, shown below.
There are many other reports that you can review from the software including daily reports, comparisons, trends, and statistics. You can also look at different time frames of data, which can be very helpful if you are trying to identify a pattern related to a certain time. For example, for people with diabetes who menstruate, it can sometimes be challenging to manage glucose levels, so reviewing the time frame during menstruation could help with management.2
Step 2: Examining the Data
The example AGP shows two weeks of CGM data and gives the average glucose information in the top left, then shows the percent time spent very low (<54 mg/dl or <3mmol/L), low (<70 mg/dl or 3.9 mmol/L), in range (70-180 mg/dl or 3.9-10 mmol/L), high (>180 mg/dl or >10 mmol/L), and very high (>250 mg/dl or 13.9 mmol/L).
In general, the goals for Time in Range are >70%, for time low <4%, for very low <1%, for high <25% and very high <5%. Sometimes the goals are different depending on age, type of diabetes, and if you are pregnant. The overview report shows patterns right there, removing the added variable of having to figure out your patterns.
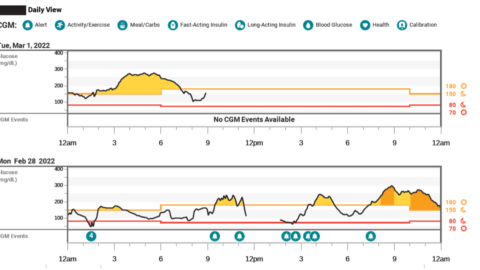
But if you don’t have a report like the overview, identifying patterns can sometimes be a little tricky. In the example AGP provided above, a clear pattern of nighttime highs seems to be what is happening. If you don’t see a clear pattern, there are often many other reports you can look at to compare, such as the one below, which shows the daily reports.
This is especially useful if you have a day where you know your routine was different than normal, such as the evening of February 28, where a very stressful meeting started at 8 PM, and you can see the blood sugars start to rise. This is consistent with the overall pattern of nighttime highs, but it’s higher than normal and should not necessarily be considered when deciding if changes should be made, since it’s not the normal routine.
Step 3: Interpreting the Data
Here are some tips on how to interpret the data, and it is not an all-inclusive list, but just a few things to help.1,3 Be sure to talk to your diabetes care team when considering adjusting insulin doses, especially for the first time.
- Look for Lows First – If you have a pattern of lows, getting those resolved is usually the first step. Sorting out whether the lows are related to a bolus, basal insulin, exercise, or something else should be your top priority.
- Pattern = Consistent for at Least 3 Days – As you probably know, diabetes loves to be inconsistent and keep us on our toes. But if you are seeing high blood sugars after lunch every day for at least three days, you’ve got yourself a pattern.
- Overnight Patterns are Usually Basal Related – If your blood sugar is dropping overnight without any bolus before bedtime, it is likely your basal rate is too high. And conversely, if your blood sugars are consistently rising, it may be a basal or nighttime snacking problem. (Guilty as charged!)
- Post-Prandial (After meal) Highs – If you’re having highs after certain meals, it may be that you need to adjust the amount of insulin you’re taking with meals. To test this theory, you can try eating the same meal for a few days in a row and taking insulin with your current insulin to carbohydrate ratio is working well, or if it needs adjusting. (Same goes for post-prandial lows, but you would adjust in the opposite manner.)
In Conclusion
Diabetes is considered a self-managed condition, but that doesn’t mean you have to do it alone. If you don’t want to identify your own blood glucose patterns and make changes, that’s completely understandable. Your diabetes health care team should be able to help review your data and give suggested changes for you. This write up is simply to help for times where you are not able to talk to your medical team or for the case of you wanting to adjust insulin doses on your own.
For more information on Identifying patterns and adjusting insulin, check out these resources:
- DiaTribe has a great article about using the AGP to identify patterns.
- CWD’s recorded session Making the Most of your Closed Loop System by Dr. Daniel DeSalvo
- Barbara Davis Center’s Panther Program has tips on how to make adjustments to different closed loop systems
References:
- Clinical Targets for Continuous Glucose Monitoring Data Interpretation: Recommendations From the International Consensus on Time in Range
- Fluctuations of Hyperglycemia and Insulin Sensitivity Are Linked to Menstrual Cycle Phases in Women With T1D
- Expert Panel Recommendations for Use of Standardized Glucose Reporting System Based on Standardized Glucometrics Plus Visual Ambulatory Glucose Profile (AGP) Data in Clinical Practice
Written and clinically reviewed by Marissa Town, RN, BSN, CDCES