

Advances in technology have helped ease some of the burden in diabetes self-management, and continuous glucose monitoring (CGM) has been one of the biggest game-changers. Having access to data in real-time, with directional arrows that help identify trends, allows people to make more informed decisions. Getting alerts that are customizable to help catch lows and highs earlier allows for tighter control.
Since 1980, the gold standard for determining whether people were “in control,” and therefore less at risk for complications from diabetes, has been the Hemoglobin A1C .1 But the A1C is only an average, and therefore does not show all the extreme blood sugar highs or lows. It also is not accurate for people with anemias, iron deficiencies, pregnancies, and other conditions.2
Fast forward to the development of the continuous glucose monitors in the late 1990’s/early 2000’s, when it became possible for people to see all the in-between glucose values, showing the range of blood sugar excursions. This was something that the A1C, as an average, could not convey. In the last few years, people with diabetes and clinicians alike have begun to acknowledge that the time spent “in range” was possibly more important, or at least just as important, as the A1C value.
In 2019, two researchers reviewed studies that showed data on both HbA1C and percent time in range, to see if there was a correlation.3 They reviewed 18 different studies and observed that when time-in-range (TIR) improved, A1C also improved. This showed that the relationship between TIR and A1C should be strong enough to use percent time-in-range as an evaluation tool for diabetes control.3
In an August 2019 consensus statement from Diabetes Care, experts from around the world agreed upon targets for continuous glucose monitoring data.2 They defined TIR as the time spent between 70-180 mg/dL (3.9-10 mmol/L), and the goals for most people with diabetes would be >70% time in range.2 They also made more recommendations based on different circumstances that are demonstrated below in the graph.
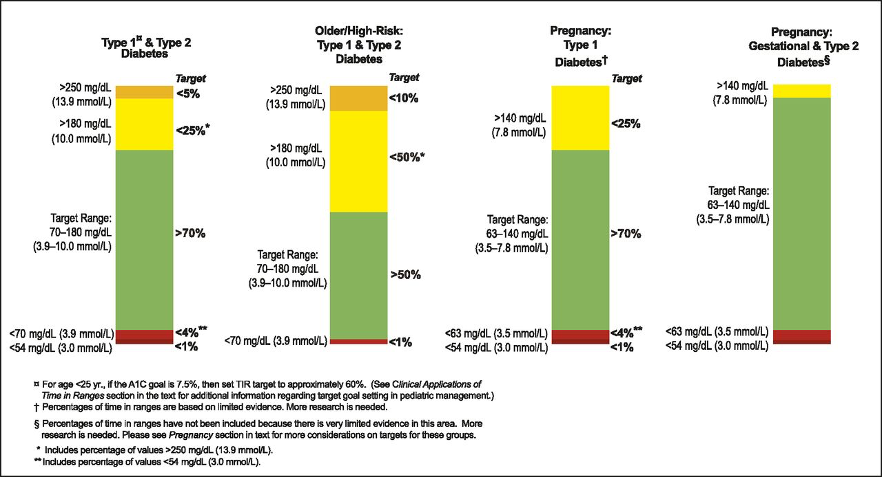
Clinical Targets for Continuous Glucose Monitoring Data Interpretation: Recommendations from the International Consensus on Time in Range, Diabetes Care, August 2019, 42(8), 1593-1603,
accessed online: https://doi.org/10.2337/dci19-0028
As shown in the graphs, the other goals are to also reduce the time spent below 70 mg/dL (3.9 mmol/L) and above 180 mg/dL (10 mmol/L). Not only are low blood sugars a possible increased risk of mortality,4,5 but the fear of hypoglycemia can cause increased anxiety for people with diabetes and their caregivers.6
The consensus report from 2019 also discusses the importance of people with diabetes and their healthcare team being comfortable interpreting the data from the CGM, and discussing the use of the Ambulatory Glucose Profile (AGP).2
The bottom line is that being able to track blood sugar trends using a continuous glucose monitor, and making time-in-range part of the overall control goal, is fast becoming the standard of care, and CWD works tirelessly to increase awareness of and access to life-saving treatments and technologies across the board.
Written and clinically reviewed by Marissa Town, RN, BSN, CDCES
- https://professional.diabetes.org/sites/professional.diabetes.org/files/media/db201811.pdf
- https://care.diabetesjournals.org/content/42/8/1593.long
- https://www.liebertpub.com/doi/10.1089/dia.2018.0310
- Acta Diabetologica, November 2019, https://link.springer.com/article/10.1007%2Fs00592-019-01447-x
- Diabetes Research Clinical Practice, December 2020, https://pubmed.ncbi.nlm.nih.gov/33039489/
- Current Diabetes Reports, July 2016, https://link.springer.com/article/10.1007%2Fs11892-016-0762-2